HOWTO: Stacked Plots with Gnuplot
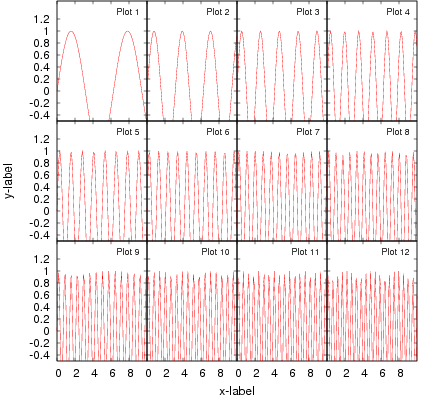
If you want to generate stacked plots with Gnuplot like this...
...you find here the corresponding script:
reset

set yrange [-0.5:1.5]
set xrange [0:10]
set xtics 0,2,9
set ytics -0.4,0.2,1.2

set lmargin 0
set bmargin 0
set tmargin 0
set rmargin 0


unset bars

set terminal postscript  eps enhanced color 'Helvetica' 24 size 5,5
set output "Dummy.eps"

set multiplot layout 3,4 scale 1,1 offset 0.5,0


set format x ""

set format y
set ylabel "  "
set label 1 "{/=18 Plot 1}" at graph 0.92, graph 0.92 right
plot sin(x*1) t ""

set format y ""
set ylabel "  "

set label 1 "{/=18 Plot 2}" at graph 0.92, graph 0.92 right
plot sin(x*2) t ""

set label 1 "{/=18 Plot 3}" at graph 0.92, graph 0.92 right
plot sin(x*3) t ""

set label 1 "{/=18 Plot 4}" at graph 0.92, graph 0.92 right
plot sin(x*4) t ""

set format y
set ylabel "y-label"
set label 1 "{/=18 Plot 5}" at graph 0.92, graph 0.92 right
plot sin(x*5) t ""

set format y ""
set ylabel "  "
set label 1 "{/=18 Plot 6}" at graph 0.92, graph 0.92 right
plot sin(x*6) t ""

set label 1 "{/=18 Plot 7}" at graph 0.92, graph 0.92 right
plot sin(x*7) t ""

set label 1 "{/=18 Plot 8}" at graph 0.92, graph 0.92 right
plot sin(x*8) t ""


set format x
set xlabel "  "
set format y
set ylabel "  "
set label 1 "{/=18 Plot 9}" at graph 0.92, graph 0.92 right
plot sin(x*9) t ""


set xlabel "x-label" offset graph 0.5, 0
set format y ""
set ylabel "  "
set label 1 "{/=18 Plot 10}" at graph 0.92, graph 0.92 right
plot sin(x*10) t ""

set xlabel "  "
set label 1 "{/=18 Plot 11}" at graph 0.92, graph 0.92 right
plot sin(x*11) t ""

set xlabel "  "
set label 1 "{/=18 Plot 12}" at graph 0.92, graph 0.92 right
plot sin(x*12) t ""

unset multiplot

set output
set terminal x11
Last modified 12 years ago
Last modified on Jul 19, 2013, 4:50:21 PM

